Jumat, 20 Maret 2020

MATLAB Grafik 3D Plots Surf, Mesh, Contour


Untuk menggambar grafik 3-dimensi diperlukan suatu koordinat tiga pasangan yaitu x, y, dan z atau biasa disebut array. Dengan tiga pasangan data dan panjangnya harus sama. Selain dari pada itu dalam mengatur grafik 3-dimensi maka digunakan instruksi untuk menampilkan grafik dengan mempertimbangkan sudut pandang untuk melihatnya.

Fungsi-fungsi dalam visualisasi data 3D
Mesh fungsi yang digunakan dalam memvisualisasikan data dalam bentuk permukaan tiga dimensi disebut fungsi mesh. Fungsi ini sering disebut sebagai grafik jala yang terdapat empat titik data terdekat dalam ruang 3D.

Surf sering disebut sebagai grafik permukaan.Fungsi ini digunakan untuk memvisualisasikan data dalam bentuk permukaan 3D dengan pewarnaannya berdasarkanbobot nilai grid. 

Contour ini digunakan untuk membuat gariskontur dari data 3D. Garis-garis kontur ini dibuat denganteknik interpolasi dari titik-titik terdekat.
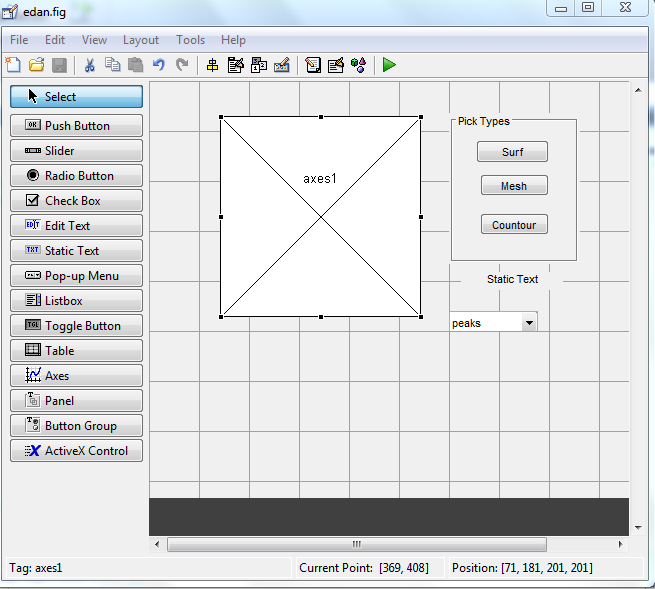
kita akan membuat tampilan dengan membuat Axes, Panel (Pict Types) yang di dalam panel terdapat Push Button1 (Suft), Push Button2 (Mesh), Push Button3 (Contour), Static Text, Pop-Up Menu (peaks, membrane, sinc untuk membuat popup menu edit dibagian String)

maka tampilan awal akan seperti :
Setelah mengetahu fungsi dari masing-masing  yang ada diatas, maka langsung mengisi script sebagai berikut :

function varargout = edan(varargin)
gui_Singleton = 1;
gui_State = struct('gui_Name',       mfilename, ...
                   'gui_Singleton',  gui_Singleton, ...
                   'gui_OpeningFcn', @edan_OpeningFcn, ...
                   'gui_OutputFcn',  @edan_OutputFcn, ...
                   'gui_LayoutFcn',  [] , ...
                   'gui_Callback',   []);
if nargin && ischar(varargin{1})
    gui_State.gui_Callback = str2func(varargin{1});
end

if nargout
    [varargout{1:nargout}] = gui_mainfcn(gui_State, varargin{:});
else
    gui_mainfcn(gui_State, varargin{:});
end

function edan_OpeningFcn(hObject, eventdata, handles, varargin)
handles.peaks = peaks(35);
handles.membrane = membrane;
[x, y] = meshgrid(-8:0.5:8);
r = sqrt(x.^2 + y.^2) +eps;
sinc = sin(r)./r;
handles.sinc = sinc;
handles.current_data = handles.peaks;
surf(handles.current_data);
handles.peaks = peaks(35);
handles.membrane = membrane;
[x, y] = meshgrid(-8:0.5:8);
r = sqrt(x.^2 + y.^2) + eps;
sinc = sin(r)./r;
handles.sinc = sinc;
handles.current_data = handles.peaks;
surf(handles.current_data);

handles.output = hObject;

guidata(hObject, handles);

function varargout = edan_OutputFcn(hObject, eventdata, handles)
varargout{1} = handles.output;

function pushbutton1_Callback(hObject, eventdata, handles)
surf(handles.current_data);

function pushbutton2_Callback(hObject, eventdata, handles)
mesh(handles.current_data);

function pushbutton3_Callback(hObject, eventdata, handles)
contour(handles.current_data);

function popupmenu2_Callback(hObject, eventdata, handles)
val = get(hObject, 'Value');
str = get(hObject, 'String');
switch str{val}
    case 'peaks' % User selects peaks
        handles.current_data = handles.peaks;
    case 'membrane' % User selects membrane
        handles.current_data = handles.membrane;
    case 'sinc' % User selects sinc
        handles.current_data = handles.sinc;
end
guidata(hObject, handles);

function popupmenu2_CreateFcn(hObject, eventdata, handles)
if ispc && isequal(get(hObject,'BackgroundColor'), get(0,'defaultUicontrolBackgroundColor'))
    set(hObject,'BackgroundColor','white');
end

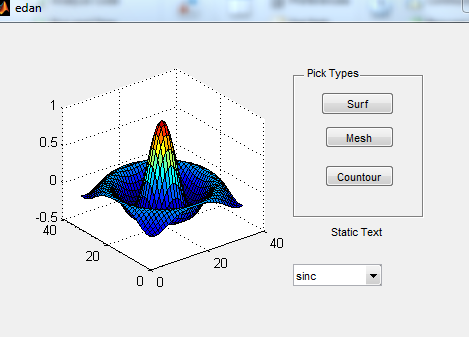
Setelah  mengisi script diatas dengan benar maka langsung saja di run , tapi sebelum di run harap terlebih dahulu di cek kembali scriptnya  ya agar sukses sewaktu di run oke langsung saja .

begini tampilan setelah run
 ini tampilan saat di Run lalu klik bagian static text pilih 'peaks' dan hasil diatas adalah 'peaks' dengan pop up menu ' surf '.

 gambar diatas adalah hasil dari 'peaks' dengan  pop up menu mesh yah.
 dan gambar diatas adalah hasil dari 'peaks' dengan pop up menu countour yah.

selanjutnya kita pilih static text pilih 'membrane' lalu pada pop up menu nya seperti yang diatas yah
begini tampilannya  :
 gambar diatas adalah hasil dari static text 'membrane' dengan pop up menu 'surf'.
 gambar diatas adalah hasil dari static text 'membrane' dengan pop up menu 'mesh'.
 gambar diatas adalah hasil dari static text 'membrane' dengan pop up menu 'contour.

selanjutnya static text sinc dengan pop up menu yang sama seperti yang diatas sebagai berikut :
gambar diatas adalah hasil dari static text 'sinc' dengan pop up menu 'surf'.
 gambar diatas adalah hasil dari static text 'sinc' dengan pop up menu 'mesh'.
gambar diatas adalah hasil dari static text 'sinc dengan pop up menu 'contour'.
selesai .

sekian dari saya semoga bermanfaat.


Selasa, 17 Maret 2020

Tugas pengolahan citra 4

Artikel Tentang Pengolahan Citra , Ekstraksi Ciri Citra Grayscale,,,???


Langkah pertama melakukan proses GUI . Setelah selesai melakukan proses Gui dan berhasil lalu klik RUN, setelah itu baru mengerjakan codingnya...
Langkah kedua,  melakukan pemograman/coding

function varargout = rizka(varargin)
% RIZKA MATLAB code for rizka.fig
% RIZKA, by itself, creates a new RIZKA or raises the existing
% singleton*.
%
% H = RIZKA returns the handle to a new RIZKA or the handle to
% the existing singleton*.
%
% RIZKA('CALLBACK',hObject,eventData,handles,...) calls the local
% function named CALLBACK in RIZKA.M with the given input arguments.
%
% RIZKA('Property','Value',...) creates a new RIZKA or raises the
% existing singleton*. Starting from the left, property value pairs are
% applied to the GUI before rizka_OpeningFcn gets called. An
% unrecognized property name or invalid value makes property application
% stop. All inputs are passed to rizka_OpeningFcn via varargin.
%
% *See GUI Options on GUIDE's Tools menu. Choose "GUI allows only one
% instance to run (singleton)".
%
% See also: GUIDE, GUIDATA, GUIHANDLES

% Edit the above text to modify the response to help rizka

% Last Modified by GUIDE v2.5 16-Mar-2020 16:35:25

% Begin initialization code - DO NOT EDIT
gui_Singleton = 1;
gui_State = struct('gui_Name', mfilename, ...
                   'gui_Singleton', gui_Singleton, ...
                   'gui_OpeningFcn', @rizka_OpeningFcn, ...
                   'gui_OutputFcn', @rizka_OutputFcn, ...
                   'gui_LayoutFcn', [] , ...
                   'gui_Callback', []);
if nargin && ischar(varargin{1})
    gui_State.gui_Callback = str2func(varargin{1});
end

if nargout
    [varargout{1:nargout}] = gui_mainfcn(gui_State, varargin{:});
else
    gui_mainfcn(gui_State, varargin{:});
end
% End initialization code - DO NOT EDIT


% --- Executes just before rizka is made visible.
function rizka_OpeningFcn(hObject, eventdata, handles, varargin)
% This function has no output args, see OutputFcn.
% hObject handle to figure
% eventdata reserved - to be defined in a future version of MATLAB
% handles structure with handles and user data (see GUIDATA)
% varargin command line arguments to rizka (see VARARGIN)

% Choose default command line output for rizka
handles.output = hObject;

% Update handles structure
guidata(hObject, handles);

% UIWAIT makes rizka wait for user response (see UIRESUME)
% uiwait(handles.figure1);


% --- Outputs from this function are returned to the command line.
function varargout = rizka_OutputFcn(hObject, eventdata, handles)
% varargout cell array for returning output args (see VARARGOUT);
% hObject handle to figure
% eventdata reserved - to be defined in a future version of MATLAB
% handles structure with handles and user data (see GUIDATA)

% Get default command line output from handles structure
varargout{1} = handles.output;


% --- Executes on button press in pushbutton1.
function pushbutton1_Callback(hObject, eventdata, handles)
[name_file1,name_path1] = uigetfile (.....
    {'*.bmp;*.jpg;*.tif','files of type (*.bmp,*.jpg,*.tif)';
    '*.bmp','file Bitmap (,.bmp)';..........
    '*.jpg','file jpeg (*.jpg)';
    '*.tif','file Tif (*.tif)';
    '*.*','All files (*.*)'},.....
    'Open Image');

if ~isequal (name_file1,0)
    handles.data1 = imread (fullfile(name_path1,name_file1));
    guidata(hObject,handles);
    axes(handles.axes1);
    imshow(handles.data1);
else
    return;
end


% hObject handle to pushbutton1 (see GCBO)
% eventdata reserved - to be defined in a future version of MATLAB
% handles structure with handles and user data (see GUIDATA)


% --- Executes on button press in pushbutton2.
function pushbutton2_Callback(hObject, eventdata, handles)
image1 = handles.data1;
gray = rgb2gray(image1);
axes(handles.axes2);
imshow(gray);
handles.data2=gray;
guidata(hObject,handles);

% hObject handle to pushbutton2 (see GCBO)
% eventdata reserved - to be defined in a future version of MATLAB
% handles structure with handles and user data (see GUIDATA)


% --- Executes on button press in pushbutton3.
function pushbutton3_Callback(hObject, eventdata, handles)
thresh=handles.data3;
[name_file_save,path_save] = uiputfile (...
    {'*.bmp','file bitmap (*.bmp)';...
    '*.jpg','file jpeg (*.jpg)';
    '*.tif','file Tif (*.tif)';
    '*.*','All Files (*.*)'},...
    'SAVE IMAGE');

if ~isequal (name_file_save,0)
   imwrite(thresh,fullfile(path_save,name_file_save));
else
    return;
end

% hObject handle to pushbutton3 (see GCBO)
% eventdata reserved - to be defined in a future version of MATLAB
% handles structure with handles and user data (see GUIDATA)


% --- Executes on slider movement.
function slider1_Callback(hObject, eventdata, handles)
gray=handles.data2;
value=get(handles.slider1,'value');
thresh=imcomplement(im2bw(gray,value/255));
axes(handles.axes2);
imshow(thresh);
handles.data3=thresh;
guidata(hObject,handles);
set(handles.edit1,'string',value)

% hObject handle to slider1 (see GCBO)
% eventdata reserved - to be defined in a future version of MATLAB
% handles structure with handles and user data (see GUIDATA)

% Hints: get(hObject,'Value') returns position of slider
% get(hObject,'Min') and get(hObject,'Max') to determine range of slider


% --- Executes during object creation, after setting all properties.
function slider1_CreateFcn(hObject, eventdata, handles)
% hObject handle to slider1 (see GCBO)
% eventdata reserved - to be defined in a future version of MATLAB
% handles empty - handles not created until after all CreateFcns called

% Hint: slider controls usually have a light gray background.
if isequal(get(hObject,'BackgroundColor'), get(0,'defaultUicontrolBackgroundColor'))
    set(hObject,'BackgroundColor',[.9 .9 .9]);
end


function edit1_Callback(hObject, eventdata, handles)
% hObject handle to edit1 (see GCBO)
% eventdata reserved - to be defined in a future version of MATLAB
% handles structure with handles and user data (see GUIDATA)

% Hints: get(hObject,'String') returns contents of edit1 as text
% str2double(get(hObject,'String')) returns contents of edit1 as a double


% --- Executes during object creation, after setting all properties.
function edit1_CreateFcn(hObject, eventdata, handles)
% hObject handle to edit1 (see GCBO)
% eventdata reserved - to be defined in a future version of MATLAB
% handles empty - handles not created until after all CreateFcns called

% Hint: edit controls usually have a white background on Windows.
% See ISPC and COMPUTER.
if ispc && isequal(get(hObject,'BackgroundColor'), get(0,'defaultUicontrolBackgroundColor'))
    set(hObject,'BackgroundColor','white');
end

Setelah proses coding selesai baru akan muncul hasil proses RUN-nya, setelah itu kita bisa mencobanya.
contohnya seperti yang ad di bawah ini:
a. Langkah pertama membaca dan menampilkan RGB asli
B. Kedua mengkonveksi citra RGB menjadi citra Grayscal.
Hasil dari save image pada proses di atas !!!


Jumat, 09 Maret 2018

PROGRAM I

Private Sub cmdbatal_Click()
txtnama.SetFocus
txtnama = ""
txtnpm = ""
txtjurusan = ""
txtpstudy = ""
txttahun = ""
txtnurut = ""
txtbp = ""
End Sub

Private Sub cmdkeluar_Click()
End
End Sub
Private Sub cmdlagi_Click()
txtnama.SetFocus
txtnama = ""
txtnpm = ""
txtjurusan = ""
txtpstudy = ""
txttahun = ""
txtnurut = ""
txtbp = ""
End Sub
Private Sub cmdproses_Click()
Dim Z As String
txttahun = "20" & Left(txtnpm, 2)
txtnurut = Right(txtnpm, 3)
Z = Mid(txtnpm, 3, 1)
If Z = "1" Then
txtjurusan = "Sistem Informasi"
ElseIf Z = "2" Then
txtjurusan = "Teknik Informatika"
ElseIf Z = "3" Then
txtjurusan = "Manajemen Informatika"
ElseIf Z = "4" Then
txtjurusan = "Manajemen & Komp.Akuntansi"
End If
Dim Q As String
Q = Mid(txtnpm, 4, 2)
If Q = "01" Then
txtpstudy = "Strata Satu"
txtbp = "1950000"
ElseIf Q = "02" Then
txtpstudy = "Diploma Empat"
txtbp = "1750000"
ElseIf Q = "03" Then
txtpstudy = "Diploma Tiga"
txtbp = "1650000"
ElseIf Q = "04" Then
txtpstudy = "Diploma Dua"
txtbp = "1450000"
End If
End Sub
Private Sub txtnama_KeyPress(KeyAscii As Integer)
If KeyAscii = 13 Then
txtnpm.SetFocus
End If
End Sub

PROGRAM H

Private Sub cbokode_Click()
Dim A, M As String
Select Case cbokode
Case "P205"
A = "Pentium II 500 Mega Hz"
M = "1500000"
Case "P308"
A = "Pentium III 800 Mega Hz"
M = "2100000"
Case "P310"
A = "Pentium III 1.0 Giga Hz"
M = "3500000"
Case "P415"
A = "Pentium IV 1.5 Giga Hz"
M = "4000000"
Case "P417"
A = "Pentium IV 1.7 Giga Hz"
M = "4200000"
Case "P419"
A = "Pentium IV 1.9 Giga Hz "
M = "5500000"
End Select
txtjk = A
txths = M
txtjj.SetFocus
End Sub
Private Sub Command1_Click()
txthp = Val(txtjj) * Val(txths)
If txthp >= 30000000 Then
txtdis = 0.15 * Val(txthp)
ElseIf txthp >= 25000000 Then
txtdis = 0.1 * Val(txthp)
ElseIf txthp >= 20000000 Then
txtdis = 0.05 * Val(txthp)
ElseIf txthp >= 15000000 Then
txtdis = 0.02 * Val(txthp)
End If
txthb = Val(txthp) - Val(txtdis)
End Sub
Private Sub Command2_Click()
cbokode.SetFocus
cbokode = "Pilih Kode Komputer"
txtjk = ""
txths = ""
txtjj = ""
txthp = ""
txtdis = ""
txthb = ""
End Sub
Private Sub Command3_Click()
Unload Me
End Sub
Private Sub Form_Load()
cbokode.AddItem "P205"
cbokode.AddItem "P308"
cbokode.AddItem "P310"
cbokode.AddItem "P415"
cbokode.AddItem "P417"
cbokode.AddItem "P419"
End Sub


Entri yang Diunggulkan

MATLAB Grafik 3D Plots Surf, Mesh, Contour

Untuk menggambar grafik 3-dimensi diperlukan suatu koordinat tiga pasangan yaitu x, y, dan z atau biasa disebut array.  Dengan tiga pasang...